Summary
First published by the National Cancer Intelligence Network in 2010, Routes to Diagnosis defined a methodology to determine the route a patient took through the healthcare system before receiving a cancer diagnosis. Unexpected differences in how patients were diagnosed were uncovered, including large variation in short-term survival and many inequalities across different patient groups and cancers. Updates have been used to chart the impact of the National Awareness and Early Diagnosis Initiative (NAEDI), early diagnosis campaigns, improved treatments and the evolution of screening programmes. Results are used to monitor the changes in the distribution of cancers, and to understand better where we can best focus our efforts to improve outcomes.
Challenge
As part of NAEDI, Cancer Research UK pushed us to quantify how people come to be diagnosed with cancer. We knew that survival rates for cancer in England and the UK were poor compared to our European counterparts and suspected it might be due to later diagnosis. At that time we knew that less than 10% of cancers were diagnosed through screening, and understood something about the percentage of people being referred as a Two Week Wait, but we had no idea how many came via other GP referrals, or through A&E, or were picked up in secondary care, say when a patient is being treated for an unrelated condition. The challenge was to use routine datasets and consider how we could mesh together a variety of data sources to understand patients’ routes to diagnosis. The intention was to identify a route for all cancer patients, not just ‘the big four’. Then the results could be scrutinised by route, age, sex, ethnicity, deprivation and geographical area. Crucially, the patient outcomes, namely survival time after diagnosis, could be examined and compared.
Objectives
The original objectives of the Routes to Diagnosis project were to answer questions such as what are the routes to diagnosis for patients diagnosed with cancer? Can we work backwards through their cancer journey and ascertain the sequence of events that took them to that diagnosis? Do we understand the differences that age, sex, ethnicity, deprivation and geographical area may have made in reaching that diagnosis? Does route to diagnosis impact on the stage of the cancer at diagnosis?
Solution
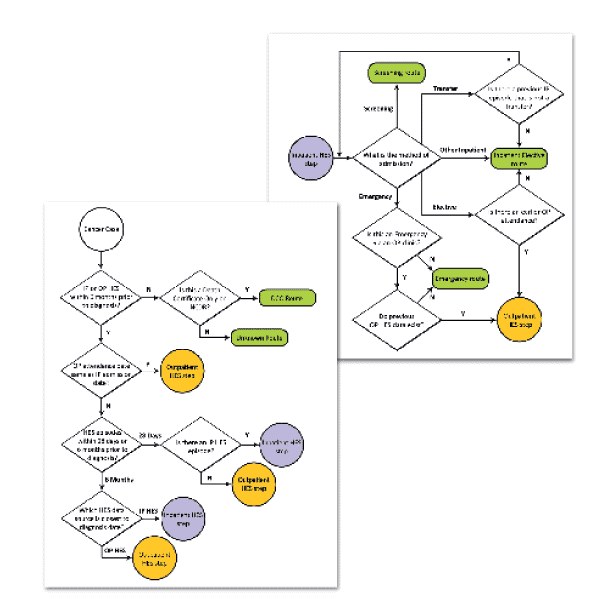
Pilot results helped us further define the questions we were asking of the data, and the work was expanded to cover all patients diagnosed in England in 2007. The approach taken was to undertake large-scale linking of national datasets with Cancer Registration data. This enabled comprehensive coverage though was subject to information governance issues and dataset availability. Data sets were linked at tumour level using NHS number. The algorithm first used HES data to categorise the route for each tumour individually. The project team identified 135 different pathways to diagnosis: these were grouped into eight Route categories. National Screening Programme and CWT data linked by NHS number to the cancer registration record were examined with the assignment of route potentially changing to either a ‘Screening’ or ‘TWW’ route. For cases with no HES activity the route was classified as Unknown or DCO.
Results
The initial publication revealed for the first time the proportion of cancers diagnosed as an emergency presentation – one in four cancers, and that the survival for this cohort was the lowest out of those analysed. The most recent data covering 2006-2013 shows a reduction in these emergency presentations, down to 20% for all cancers and an increase in the Two Week Wait referral route. The results also cover the introduction and roll-out of the bowel cancer screening programme, with a rise in the proportion of screen-detected cancers seen for the relevant age ranges. Survival for this route is high, a trend seen for the other screening programmes. There was a large variation by cancer site, with 56 cancers included in the latest publications. This focus on the less common cancers can be used to inform site specific work and awareness campaigns, as well as to support the vital work of the smaller cancer charities and patient groups. Variation was also seen between the sexes for some cancers, but more striking was the variation by age – with older age groups having a high proportion of emergency presentations. Inequalities by deprivation were also seen for some sites.
Learnings
In 2014 we worked with Quality Health, the administrators of the National Cancer Patient Experience Survey, to undertake analyses to match survey results to the Routes to Diagnosis data. The results showed that patients who entered treatment through an emergency route are less likely to be positive about their care and treatment – on a wide range of questions – compared to patients entering through a planned pathway. We are currently working with charities to launch a set of site-specific briefings and in 2016 we hope to undertake further work matching patient experience data with Routes to Diagnosis, to better understand the impact that variation and inequalities have on outcomes and experience.
Evaluation
The methodology was published in the British Journal of Cancer in 2012 and has also been reviewed by the Health & Social Care Information Centre (HSCIC) Indicator Assurance Service, for use in the CCG Outcomes Indicator Set.


